|
Automatic translation option
|
|
The data collected by the Scripps project shows that the increase in carbon dioxide remains at a high rate. In the years 2011-2016 it was over ten units; a few more than between 1991 and 1996. The amount of oxygen in the atmosphere is also reduced. (Scripps Institution of Oceanography).
The same institution was collecting samples from the atmosphere for many years, in 1958 the average annual concentration of carbon dioxide in the atmosphere in Hawaii was 315 particles. In 2008 this value was 385, in 1990 354, and in 1980 338 and 325 in 1970. In the last decade, the increase in carbon dioxide does not differ from what it looked like in the second half of the last century. Thanks to advancement in technology, anyone can track the current concentration of carbon dioxide in the atmosphere. This data from Goddard Earth Observing System GEOS-5/GMAO/NASA is more worrying. Brighter areas mean a high concentration of carbon dioxide in the atmosphere. The effects of human activities are clearly visible in the northern hemisphere. Depending on weather conditions and season, these values are changing. During winter vegetation is less beneficial for climate. There is more CO2 coming from residential heating as well. Concentration is higher above land which can contribute to dry winter conditions. Traffic also has a big impact. Sometimes it is clearly visible that during rush hours, there is a sharp local increase.
The same institution was collecting samples from the atmosphere for many years, in 1958 the average annual concentration of carbon dioxide in the atmosphere in Hawaii was 315 particles. In 2008 this value was 385, in 1990 354, and in 1980 338 and 325 in 1970. In the last decade, the increase in carbon dioxide does not differ from what it looked like in the second half of the last century. Thanks to advancement in technology, anyone can track the current concentration of carbon dioxide in the atmosphere. This data from Goddard Earth Observing System GEOS-5/GMAO/NASA is more worrying. Brighter areas mean a high concentration of carbon dioxide in the atmosphere. The effects of human activities are clearly visible in the northern hemisphere. Depending on weather conditions and season, these values are changing. During winter vegetation is less beneficial for climate. There is more CO2 coming from residential heating as well. Concentration is higher above land which can contribute to dry winter conditions. Traffic also has a big impact. Sometimes it is clearly visible that during rush hours, there is a sharp local increase.
The big mistake of policy aiming to reduce carbon dioxide emission was the exemption of developing countries from the obligations to do so. The Kyoto Protocol, which marked the trend of international policy in this area, was signed in 1997, entering into force in 2005. China, however, has become the largest source of carbon dioxide in the atmosphere. In 2000 it emitted 3 billion tons of CO2, and by 2016 it was already 9.5 billion tons. In India, emissions increased from 880 million tonnes to 2.3 billions over the same period of time. Total global increase in 2000-2016 amounted to 10 billion tonnes in total, giving 37 billions tonnes. The determinant for international policy in the sphere of global warming is the work of the IPCC Intergovernmental Panel on Climate Change. In its fifth report - AR5 on expected climate change, it introduced new greenhouse gas emission scenarios for Representative Concentration Pathways. These scenarios are named based on the expected radiation forcing at the end of the age of RCP2.6, RCP4.5, RCP6, RCP8.5. The RCP2.6 scenario assumes achieving the maximum emission in 2020 in the amount of 10.206 PgC / yr = 37.39 tons of CO2. By 2030, it envisages reducing emissions to 29.11 billion tons, and then successively to zero before the end of the century. The average concentration of carbon dioxide in the atmosphere in 2020 should be 411 ppm. In 2050, reach a maximum of 442ppm, in 2100 fall to 420ppm and to 380 ppm at 2200. The RCP4.5 scenario assumes that emissions will not be reduced to 2060. In this case, carbon dioxide concentration would be 460ppm in 2040 and 538ppm in 2100.
All the implications associated with the average concentration of carbon dioxide have the weakness that due to continuous emissions in the region where the source is located, the concentration can be much higher. As a result, the above-land radiation force is greater than over the oceans, increasing the risk of drought.
To achieve the desired effects of the RCP2.6 scenario, sufficient funds should be invested in the energy sector. Without including major emitters among developing countries, reducing emissions by developed countries alone will not lead to a 30% reduction in total emissions. Developed countries with binding commitments to the Kyoto Protocol: Canada (Canada withdrew from the Kyoto Protocol), EU (27), Belarus, Ukraine, United Kingdom, Kazakhstan, Australia and the United States (US did not ratified Protocol) emitted in 2016 7 billion tonnes of CO2 or 27% of global emissions. Therefore, by 2030, all emissions in these countries would have to be zero.
The 2015 Paris Agreement document obliged all countries to address climate change. In 2016, the Paris Agreement document was signed by most countries in the world. According to this agreement, all countries should take the initiative to reduce emissions. Countries were free to set their own goals. submitted in documents called National Determined Contributions - NDC. However, most of them have not presented ambitious plans .
Only European Union pledge is considered to be sufficient - 40% less than in 1990 - but it mean only some 20% from present amount. Canada's, Brazil's and Australia's are partly sufficient – 20-40%. USA administration in 2017 announces withdrawal from agreement. Some 17% of reduction from level of 2005 can be however expected. China has its goal to reduce CO2 per unit of GDP to 60-65. However this economy is growing fast. In 2005 GDP was in this country 2.28 trillions USD in 2015 it was 11 trillions USD. Therefore economical growth will make China meet its target but not cuts in CO2 emission. Seven more countries have such intensity pledges like China including big another emitter India. Other countries are Chile, Malaysia, Uzbekistan, Singapure, Uruguay and Tunisia.
Russia had not submitted its pledge and there are another 12 such countries. 36 countries have pledges that can not be quantified, including South Africa, UEA, Kuwait, Saudi Arabia. Some of them have the highest CO2 emission per capita in the world. 13 countries submitted pledges with BAU – business as usual – targets. These are based on emission reduction below projected level in 2030 if no policies are implemented. In fact it means additional emission from the current level. Another 38 countries rely on international financial help and even these ones have BAU targets as well. Based on the NDC's declared so far by the parties to the agreement, it is not possible to achieve the required concentration level for the RCP2.6 scenario.
Using Science Applications International Corporation calculations that allow estimating the cost of power plant construction, you can calculate the budget of transition towards zero emission economy. (only as an example) for European countries producing the most energy from fossil fuel combustion and China. The base costs of power plant construction are: for Advanced Pulverised Coal with CCS are: capacity 650MW 5227 USD/kw, capacity 1300MW – 4724; Advanced Generation Natural Gas with CCS: capacity 340MW- 2900 USD/kw, Integrated Gasification Combined Cycle with CCS: 520MW- 6599USD/kW; Hydroelectric: 250MW – 2936USD/kW, Onshore Wind 100Mw- 2213 USD/kW, Offshore Wind 400MW – 6230USD/kW; Utility Scale Photovoltaic 20 MW – 4183 USD/kW, 150MW – 3873 USD/kW.
From an economic point of view, it seems possible to reduce emissions in a short time. Among the countries in the table, only Ukraine would need financial assistance to convert 50% capacity within five years. Other countries need to spend up to 2% of GDP every year, which is amount of money often spent on defence. These costs seem to be very high in the case of China but should actually be lower due to the fact that the estimation concerned the construction of power plants in the United States based on the economic conditions there. According to the law of economies of scale, the prices of components used in the construction of photovoltaic power plants should fall over time, due to the decrease in unit cost of production in the event of an increase in production volume. On the other hand, although it is cheaper to build gas power plants with Carbon Capture and Storage (CCS) technology, it require to store billions of tons of carbon dioxide for years, it is hard to imagine, that this is not associated with the risk of releasing the stored part into the atmosphere. Extraction of fossil fuels lead to methane emission - which is potent greenhouse gas - CCS cannot change it.
Success in the fight against global warming depends, however, on the state of the world's forests and ocean flora. Droughts have a negative impact on carbon dioxide balance. The huge forest fires that are their consequence are a source of additional carbon dioxide emissions into the atmosphere and lead to losses in forests for many years, having a long-term negative impact on the carbon dioxide balance.
Success in the fight against global warming depends, however, on the state of the world's forests and ocean flora. Droughts have a negative impact on carbon dioxide balance. The huge forest fires that are their consequence are a source of additional carbon dioxide emissions into the atmosphere and lead to losses in forests for many years, having a long-term negative impact on the carbon dioxide balance.
Fig. Siberia’s wildfires in 2016 seen as carbon monoxide concentration.
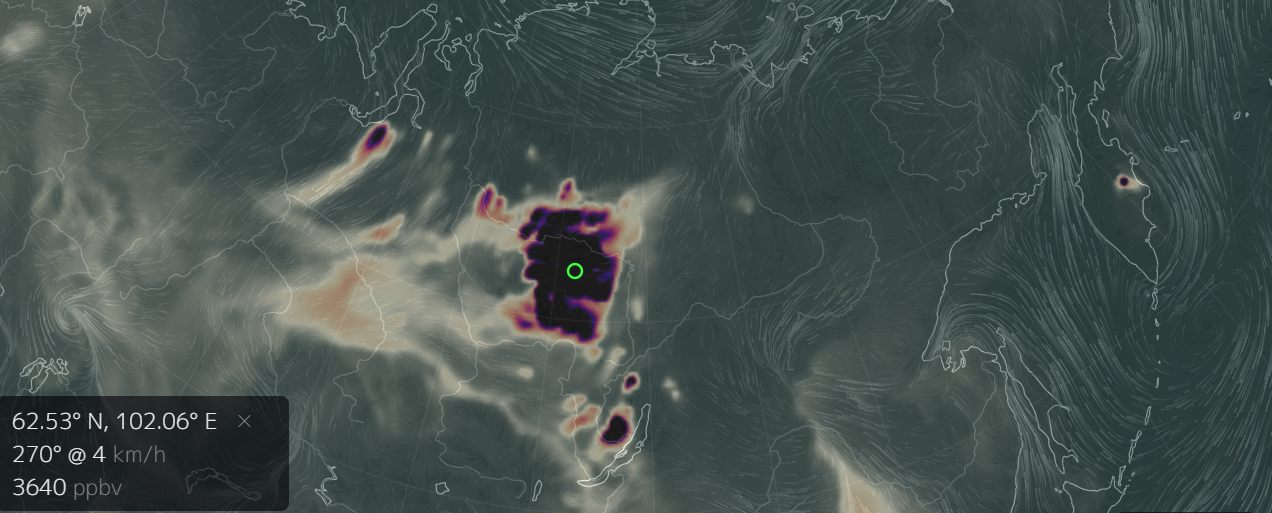
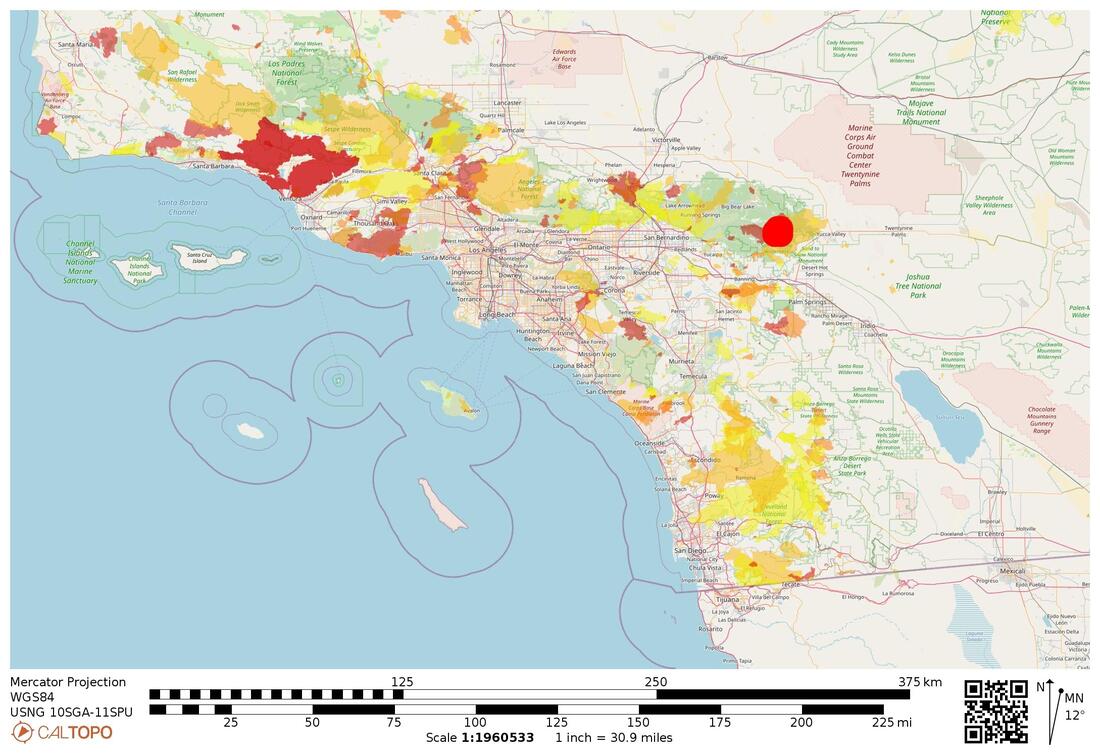
From 2001 to 2019 Russia lost 8.4% of forest cover gfw.global/2IhIYxL it could be not all because wildfires but in some areas like in southern California, where this loss is 40%, it were certainly wildfires.
Fig. History of wildfires in area surrounding Los Angeles, California US
In 2019, 80,000 square kilometers of forests burned in Australia. These were densely wooded areas, which did not happen in the past, when mainly savannas burned. In 2018, no less forests burned in Siberia - according to Greenpeace. Huge fires were also there in 2016. These are not isolated cases. Forest fires are very common in the savannas of Africa not sparing dense tropical forests around the equator. Other areas of the world are also under threat, including the Amazon rainforest.
Due to continuous emissions, the concentration of carbon dioxide in the northern hemisphere in densely populated areas is sometimes much higher than average. If this value will be close to the RCP4.5 scenario we can expect effects in a given area corresponding to this scenario. Every drought will carry the risk of wildfires and food shortages, prices can rise leading to inflation and even famine may occur. Periods in which the soil will be less moist will result in lower vegetation efficiency in converting carbon dioxide to oxygen and will cause a decrease in crops yield.
Fig. Number of days with soil moisture below annual min. in years 2040 - 2070 (change in percents). Climate prediction for RCP 4.5 scenario.
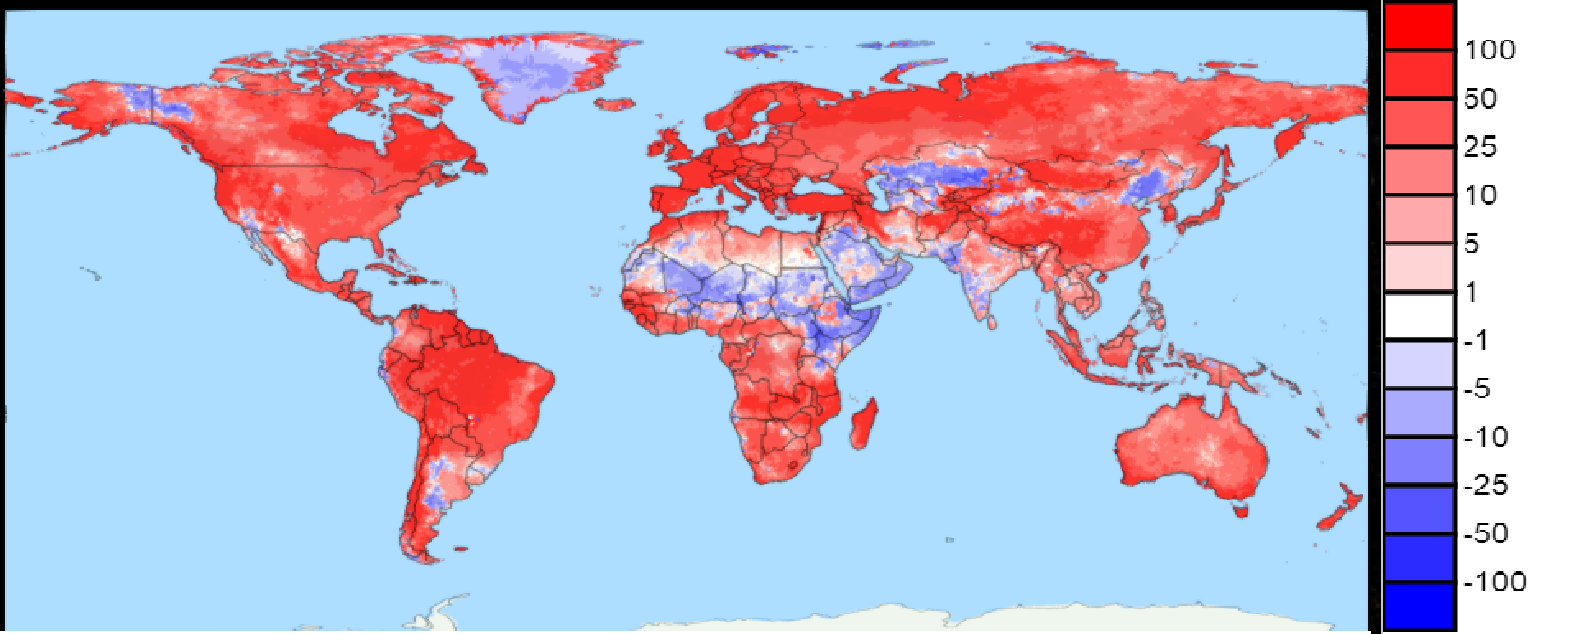
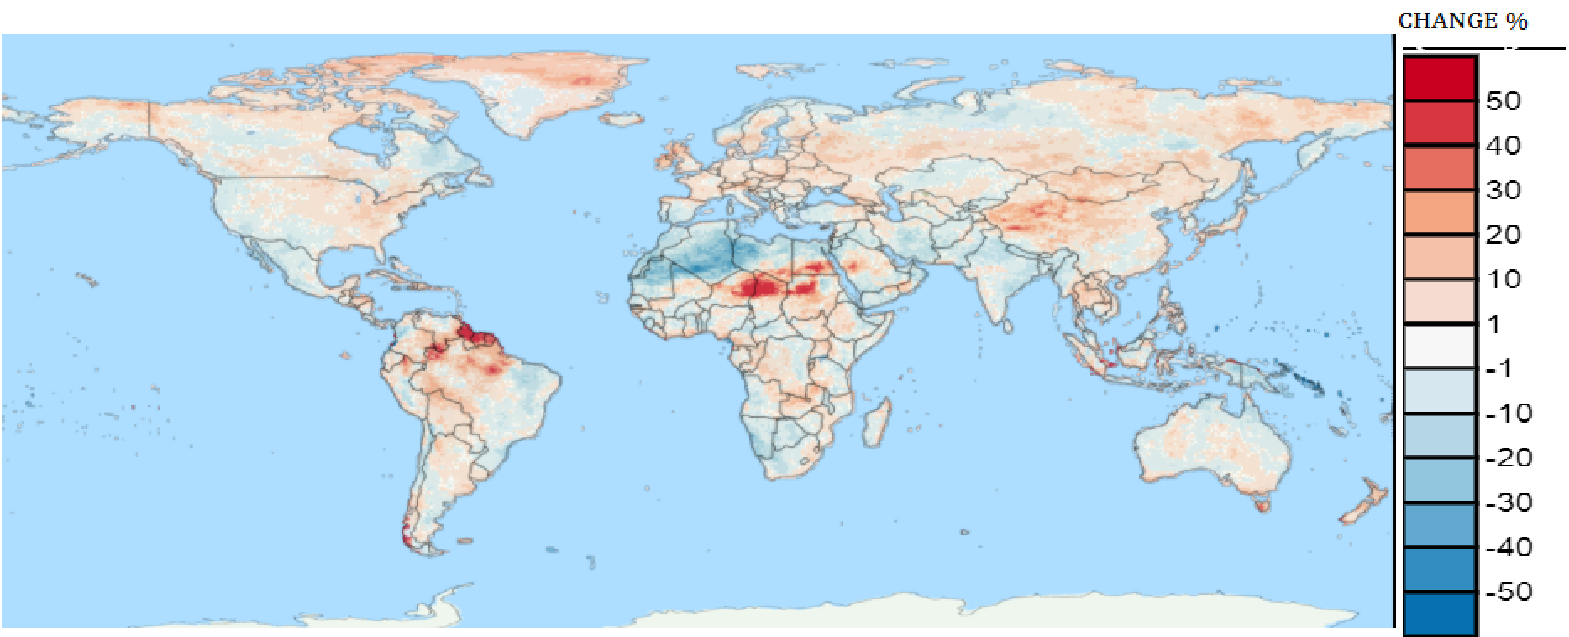
Fig. Number of dry spells for years 2040 - 2070. Climate prediction for RCP4.5 scenario.
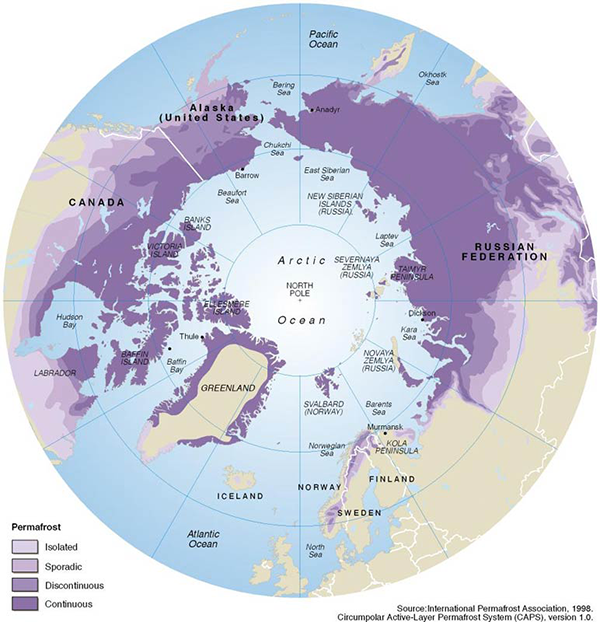
Higher CO2 concentration carries a greater risk of feedback effects and reaching tipping point. IPCC consider that boreal forests dying back can lead to abrupt warming. These are forests of Siberia and Canada that make up 30% of the world's forests. It seems very likely that their dying may, as a consequence, lead to accelerated melting of permafrost. There is a lot of organic matter in the soil frozen by thousands of centuries, which when it is defrosted will begin to be broken down by bacteria. In the decomposition process they release carbon dioxide - when the soil is rich in oxygen, or methane - if the soil is wet and there is not much oxygen in it. Methane is 100 times more potent greenhouse gas, but it's life in the atmosphere is only 12 years. Currently (year 2017) emission to the atmosphere from waste, burning of fossil fuels and agriculture is 8.25 billion tonnes (of CO2e). It makes 0.516 W / m² radiative forcing while CO2 forcing is 2.076W / m² and all greenhouse gases make 3.140 W / m² according to the NOAA Annual Greenhouse Gas Index – AGGI - 2020. (There is more tipping points, link to an explainer is in further reading)
Additional billions tonnes of CO2e yearly from permafrost could result in radiative forcing to raise even if we stop emission. An international study headed by Edward Schuur of the University of Florida doubled previous estimates of the carbon content of permafrost ( or methane depending on circumstance) to about 1600 billion tonnes - roughly a third of all the carbon in the world's soils and twice as much as is in the atmosphere. Even small initial release may in consequence have significant impact as released close to the surface would remain in area for some time before being dispersed by the wind causing further thawing of permafrost.
Fig. Map of permafrost.
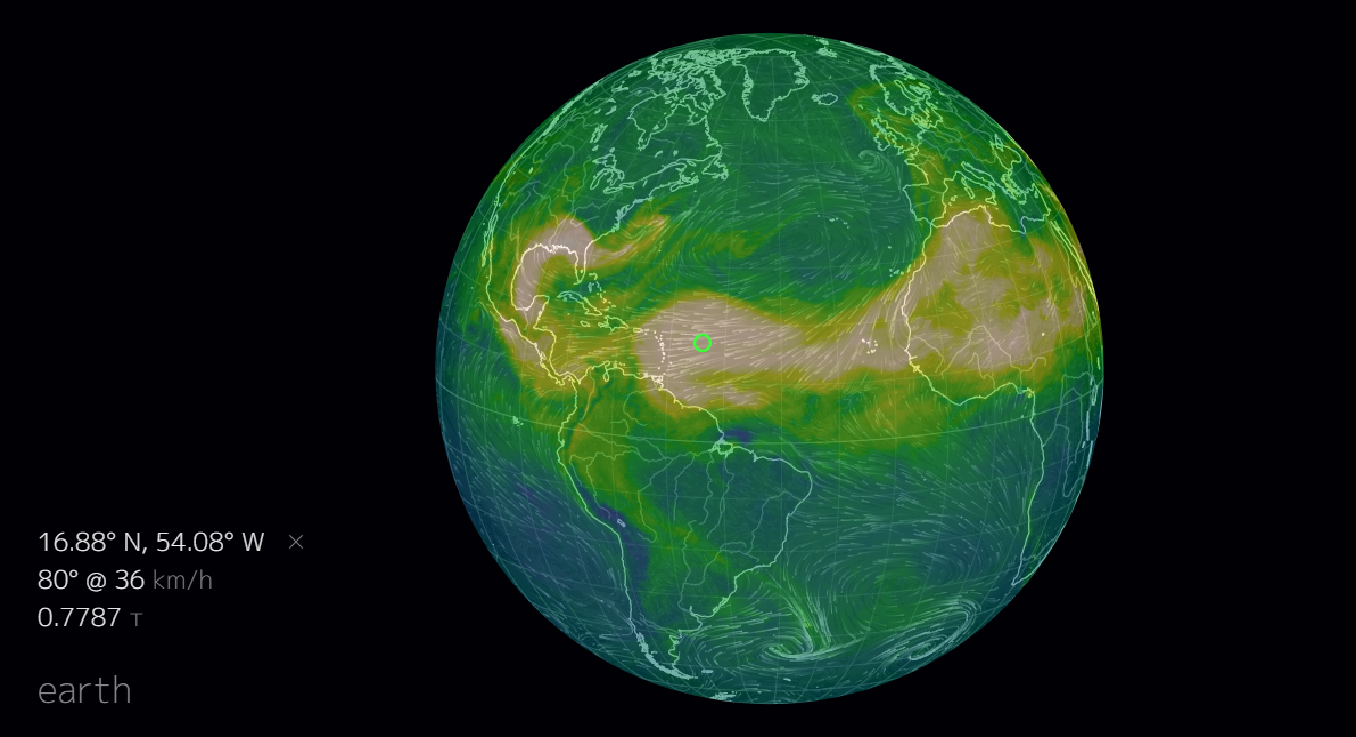
Recent study show that desert dust has a bigger impact on global temperature than previously thought. There is four times more coarse dust which makes around 0.24 W/m² radiative forcing. Bigger dust storms have a big impact on temperature. Dust can travel long distance. It is common that some of Saharan dust cross Atlantic.
Fig. Saharan dust - 26.06.2020
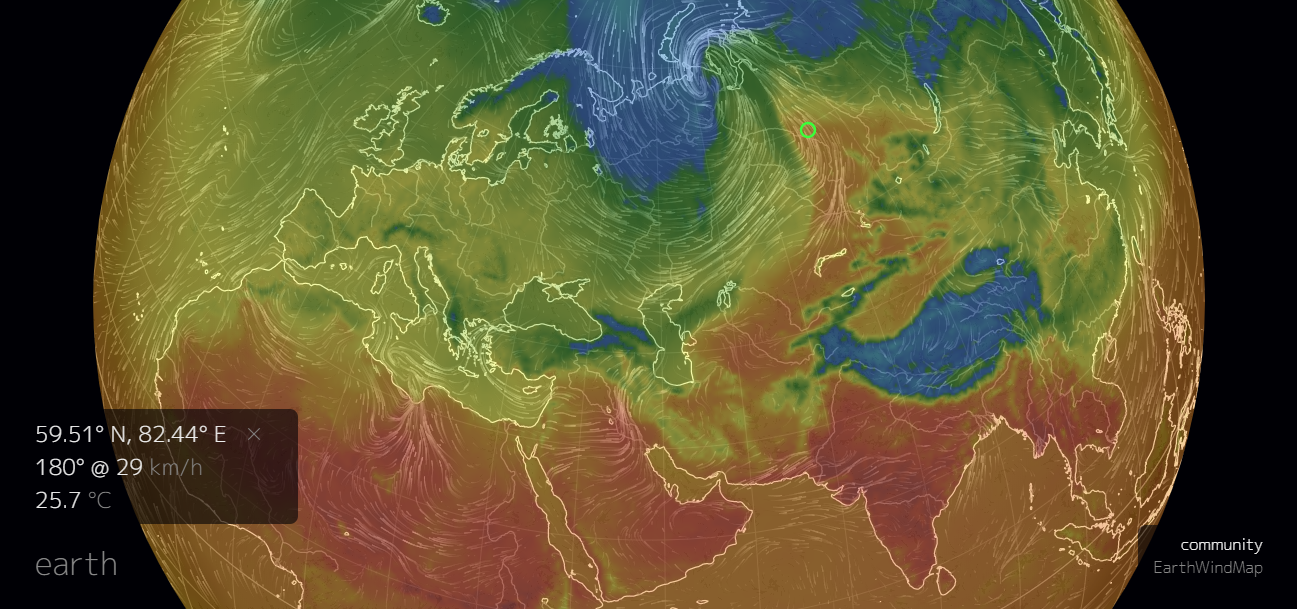
In Spring 2020 hot air with some dust reached Western Siberia, the outcome of this event was very high temperature for this part of the world – over 20 centigrades in April.
Fig. Temperature in Western Siberia - April 2020.
Emission reduction and employment in mining
At what state of the atmosphere will we reduce amount of carbon dioxide it is difficult to determine. The first area of human activity must be the creation of an economy driven by clean renewable energy, the second step is the introduction of electric vehicles. However, in the event of stopping the production of energy from coal combustion, large social opposition may arise. This industry gives jobs to a huge number of people. Coal must be extracted, transported, processed, loaded, unloaded, stored. At every stage you need human hands and someone to manage the group of people. Machines and vehicles, which someone has to design and manufacture, are also needed for extraction and processing.
In Great Britain, after the decision of Margaret Thatcher in 1984, despite the strike of half of 187,000 miners, 20 mines were closed. 20,000 people lost their jobs. On November 8, 1989, during the UN Council, Mrs. M.Thatcher said: "While the conventional, political dangers - the threat of global annihilation, the fact of regional war - appear to be receding, we have all recently become aware of another insidious danger. It is the prospect of irretrievable damage to the atmosphere, to the oceans, to earth itself '' 2 Hence maybe her nickname Iron Lady. In mining is a big work ethos and it is difficult for them to accept its loss. Although these mines were closed due to unprofitability, the resistance was enormous. A documentary film presenting these events talks about policemen who working overtime ensuring safety during strike earned enough money to buy a sports car. In 2018, 20,000 miners were on strike in Germany due to a plan to phase out coal power plants .
There is a technical possibility to preserve part of the coal sector - construction of coal power plants with the CCS system - carbon capture and storage. This system would capture carbon dioxide that would be stored underground. Construction costs, however, are much higher than without CCS amounting to 500 - 900 USD additional capital for each kW capacity of power plant, at least 25% more. Storing CO2 underground also costs money. Such a power plant - Integrated Gasification Combined Cycle - without CCS is 35% more expensive than the standard one. With CCS it makes it 60% more expensive to build. The CCS system would use 10 to 40% of the energy generated by power plants. More carbon would be needed to produce energy and thus more CO2 put to storage. Storage of billions tons of carbon dioxide is a high risk. Leaks can lead to fatal accidents. The Peterhead project in the UK is plan to build one such power plant which will have 85% of the efficiency of the carbon dioxide capture system. However, 15% still remain with the ever-increasing demand for energy. There are also toxic substances that get to the atmosphere during coal combustion, ie: sulfur dioxide, arsenic, mercury, as well as radioactive thorium and uranium. One of the methods used by governments to reduce emissions in this sector is emission fee. However it requires deep reorganisation.
Knowing the risks associated with global warming effects, greenhouse gas emissions should be reduced as soon as possible and by as much as possible. A business plan for the transition to a zero-carbon economy is needed. The plan should be supplemented with a strategy for restructuring part of the economy based on fossil fuels. It is technically possible to partially preserve the use of fossil fuels in the energy sector. It is always associated with the construction of a new generation of power plants with CCS systems. The cheapest solution for coal is Advanced Pulverized Coal with CCS, but more expensive than green energy. The use of CCS technology is also associated with the costs of carbon dioxide storage and the issue of storage safety. It is hard to imagine the lack of risk in storing billions of tonnes for years. Transition can be blocked by investors waiting for a moment in which their recent investment (i.e. Coal power plant) will bring the expected profit. In this case, an effective solution is to give manufacturing companies the opportunity to produce green energy for their own needs. This solution should be possible and supported everywhere in the world. In the fight against global warming, we must pay more attention to forests. Many forest fires are a consequence of burning grass on pastures. In drought conditions it is very dangerous and this practice should be prohibited. However lots of them start from dry lightning and only reduction of GHG emission could make wildfires less common than now. The creation of international cooperation in the fight against fires and an increase in expenditure on equipment and the number of firefighters would increase the chance of successful fire fighting operations.
One of the worst things for humankind would be societal collapse due to climate change which is needed to avoid.
One of the worst things for humankind would be societal collapse due to climate change which is needed to avoid.
How much effort you need to make in order to win fight against Climate Change should be rather taking into account not only industrial rise in concentration of CO2, but also loss of forest cover due to adaptation of land for agricultural need over ages. Some emission however occurred during Iron and Bronze Age as well. What worth of attention in discussion about changes in mean global temperature in the past is the probability that it could be caused by plagues of locust.
With regard to economical viability of climate effort, it is viable on its own as it helps keep inflation low.
In deciding what way to solve a problem, you should follow rule lat. primum non nocere. Such rule match steady state economy in which there is no need as much more of resources in future due to steady population. Some advantages of growth like more innovation as some economist say are common currently, but resources are shrinking.
With regard to stranded capital, mining could keep going as long as methane release can be fixed if fossil fuel will be used not for combustion only in other way i.e. any material made of it for insulation purposes.
Further reading:
- For National Determined Contributions visit: climateactiontracker.org/
- Tipping points explanation: www.carbonbrief.org/explainer-nine-tipping-points-that-could-be-triggered-by-climate-change?fbclid=IwAR2SKF-IVuuP9taHfOmEKYxqxRs_7pgH4oYMCWMNrVOvtDp4i8gwOetVP7Y
- For emission statistics visit:http://cait.wri.org CAIT Climate Data Explorer. 2019. Country Greenhouse Gas Emissions. Washington, DC: World Resources Institute.
- Margaret Thatcher: How PM legitimised green concerns, https://www.bbc.com/news/science-environment-22069768
- Deutsche Welle, 24 October 2018: https://www.dw.com/en/thousands-protest-german-coal-phaseout/a-46019342
- Energy Policy 35 (2007 Cost and performance of fossil fuel power plants with CO2 capture and storage. E.S. Rubin, Chao Chen, A.B. Raowww.cmu.edu/epp/iecm/rubin/PDF%20files/2007/2007b%20Rubin%20et%20al,%20Energy%20Policy%20%28Mar%29.pdf
- Kiko Network Paper, Universal failure: how IGCC wastes money and emission, November 2016www.kikonet.org/wp/wp-content/uploads/2016/11/IGCC-and-emissions_eg_final.pdf
- False Hope; Why carbon capture and storage won't save the climate, Greenpace, May 2008 web.archive.org/web/20090504081504/http://www.greenpeace.org/international/press/reports/false-hope
- Gobhard Alex Coal combustion: Nuclear Resource or Danger: web.archive.org/web/20070205103749/http://www.ornl.gov/info/ornlreview/rev26-34/text/colmain.html
- New Scientist, Arctic meltdown is a threat to humanity, 25 March 2009: web.archive.org/web/20090329075410/http://www.newscientist.com/article/mg20127011.500-arctic-meltdown-is-a-threat-to-humanity.html?full=true
- Climate models miss most of the coarse dust in the atmosphere, Science Advances 08 Apr 2020, p6, New Scientist, Arctic meltdown is a threat to humanity, 25 March 2009 doi.org/10.1126/sciadv.aaz9507
- Clarke, L., J. Edmonds, H. Jacoby, H. Pitcher, J. Reilly, R. Richels, 2007. Scenarios of Greenhouse Gas Emissions and Atmospheric Concentrations. Sub-report 2.1A of Synthesis and Assessment Product 2.1 by the U.S. Climate Change Science Program and the Subcommittee on Global Change Research. Department of Energy, Office of Biological & Environmental Research, Washington, 7 DC., USA, 154 pp. Smith, S.J. and T.M.L. Wigley, 2006. Multi-Gas Forcing Stabilization with the MiniCAM. Energy Journal (Special Issue #3) pp 373-391.Wise, MA, KV Calvin, AM Thomson, LE Clarke, B Bond-Lamberty, RD Sands, SJ Smith, AC Janetos, JA Edmonds. 2009. Implications of Limiting CO2 Concentrations for Land Use and Energy. Science. 324:1183-1186. May 29, 2009.
- van Vuuren, D., M. den Elzen, P. Lucas, B. Eickhout, B. Strengers, B. van Ruijven, S. Wonink, R. van Houdt, 2007. Stabilizing greenhouse gas concentrations at low levels: an assessment of reduction strategies and costs. Climatic Change, doi:10.1007/s10584-006-9172-9.
- Coal Not Dole, memories of the 1984/85 Miners' Strike by Guthrie Hutton ISBN 978-1-84033-329-9
- Capacity of powerplants www.nationmaster.com/nmx/ranking/combustible-fuels-electricity-production-capacities-by-type-of-producer
- Updated Capital Costs Estimates for Utility Scale Electricity Generating Plants, April 2013, U.S. Department of Energy/Science
EOP III TASK 1606, SUBTASK 3 – REVIEW OF POWER PLANT COST AND PERFORMANCE ASSUMPTIONS FOR NEMS,
Science Applications International Corporation (SAIC), Formerly R. W. Beck, Prepared by: SAIC Energy, Environment &
Infrastructure, LLC, Prepared For: Energy Information Administration www.eia.gov/outlooks/capitalcost/pdf/updated_capcost.pdf
